Reflection and analysis at the end of each financial year can be a critical part of developing new business strategies as well as reflecting on what has worked and what hasn’t. In the latest report from Quantaco, we are bringing together data from the 2023 and 2022 financial years, and by combining our vast knowledge and expertise of the Australian hospitality industry we are providing insights and analysis to help publicans and hospitality owners.
By drawing on a deep data set of 800+ hospitality venues across Australia the team are able to draw conclusions across six pivotal areas included in the report:
- Total Weekly Sales Growth
- EBITDAR Trends
- Food Weekly Sales Growth
- Beverage Weekly Sales Growth
- Wages as a percentage of sales
- Gaming Turnover
To download the full report and get access to further data and analysis, click here.
Here are some of the highlights in this end-of-financial-year report:
Total Weekly Sales Were More Volatile This Year
While the industry saw an increase of 8% in total weekly sales this year, it was heavily impacted by a harsh flu season and record-low temperatures, reducing growth in some months. That said, the food sector showed the most increase with a 14% growth in weekly sales versus beverages that only saw a 7% increase.
However, these modest numbers are likely to increase with June’s total weekly sales trending upwards and we expect to see even more improved growth in the post-COVID era, even with increasing costs.
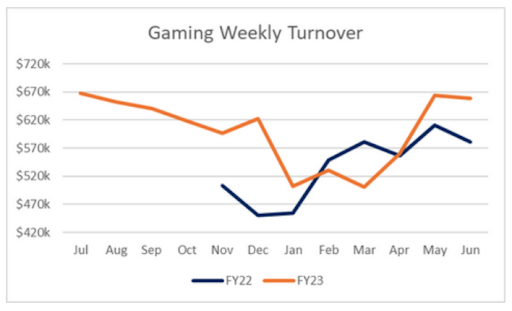
Gaming Makes a ‘U-Turn’
Our previous report showed gaming turnover in decline after the post-pandemic ‘boom’. But, as we predicted, weekly turnover has increased by an average of 9% year-on-year. While there has been a 33% variance within the year, the gaming sector has been a key point of political discussion in the NSW State election, leading to some negative publicity. It stands to reason that consumer behaviour has been impacted, but we don’t foresee this being a long-term impact for the sector.
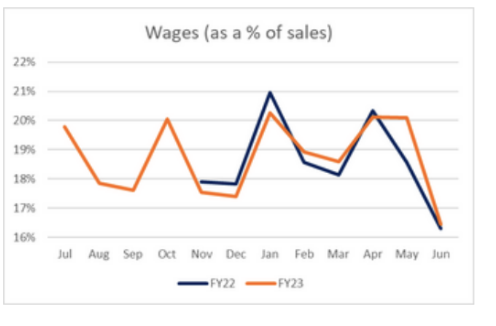
Wages Heavily Influenced by Seasons & Sales
Analysis of wages as a percentage of sales showed that while this metric has been fairly stable year-on-year, maintaining the same 19% as 2022, the monthly chart shows a different picture. Typically, we observed a rise in wage percentage during slower trading months or those months with more penalty rates being applied to wages, for example, April with four public holidays. Whereas the months with higher sales volumes saw a reduced wage percentage.
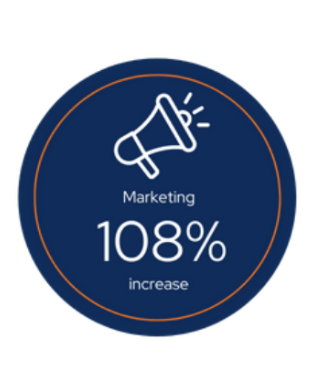
An Increase in Marketing Activities
In the report, other additional overheads such as energy, repairs and maintenance, and marketing activities were measured, and marketing was found to have a 108% increase. With consumers being more conscious of how and where they spend their money, hospitality venues have had to adjust and become more competitive through increased marketing activity and spending.
Challenges Surround Insurance & Risk
Industrial Special Risks (aka Property Insurance) have seen an increase of 7% but this is modest compared to last year’s 20% increase which will be welcome news for venues. That said, with inflation causing an increased costs for labour and materials to rebuild venues, this could increase again. Public liability insurance is also continuing to be a challenge due to the increase in frequency and severity of claims reducing the options for public liability insurance on the market.
This report reviews the financial years covering the months July 2021 to June 2022 (FY22) and July 2022 to June 2023 (FY23).
To discover more in-depth data and insights across all the key metrics, download a copy of the report for free, by visiting: https://www.quantaco.co/industry-updates/